What directing AI agents costs: three projects, measured
Three projects run on Director-Driven Development, every token priced at API rates: $2 to $3 per completed task, $50 for a 6,700-line feature, 96 percent cache reads, and what a Claude Max subscription turns that into.
Everyone building with AI coding agents has an opinion about what it costs. I had one too. So I measured it instead: three projects, every token, priced at the public API rates, over the 24 days since the first commit of the largest one. This post is the result, with the conclusions I think the numbers support and the ones they don’t.
The three projects all run on Director-Driven Development: I direct, agents build, one automatic check decides when a task is done, and every decision is written down. If you haven’t read about it, the original post explains the why and the docs explain the how.
- Director-Driven Development itself: the documentation site, which also builds and releases the three frameworks (Godot-Director, App-Director, SaaSAllTheThings) from its own task queue. Nine days.
- PKSEI, a comedy rage game in which four friends paddle a canoe catamaran across a lake, built in two and a half days and playable on itch.io. Its devlog tells the story; the repository holds the records.
- Lantern, a codename: a larger indie game, 24 days in and not yet announced. Its code base is about half done in technical functionality; the assets, the playtesting and the tuning come later.
How I measured
Claude Code keeps a transcript of every session on disk, including the subagents a session starts, and every reply in it carries the token counts: fresh input, output, cache writes, cache reads, and the model that produced it. I summed them, one entry per message, and priced them at the pay-as-you-go API rates on claude.com/pricing as of 19 October 2026: Fable 5.1 at $10 in and $50 out per million tokens, Opus 5.5 at $4 and $20, Sonnet 5.5 at $2 and $10, Haiku 5.5 at $0.10 and $0.50, with cache reads at a tenth to a fortieth of the input price and cache writes at 1.25 times it. The script is in the repository: tools/usage.py.
One thing to hold on to for the rest of the post: none of this was billed per token. All three projects ran on a Claude Max subscription. The dollar figures are what the same tokens would have cost on the API: a measure of the size of the work, not of money spent. The money comes at the end.
The numbers
| Director-Driven Development | PKSEI | Lantern | |
|---|---|---|---|
| Span | 9 days | 2.5 days | 24 days |
| Hours at the keyboard, mine | 17 | 3 | 30 |
| Hours the agent worked on its own | 24 | 14 | 96 |
| Commits | 330 (200 in the docs repo, 130 in the frameworks) | 127 | 537 |
| Tasks completed | 142 | 92 | 514 |
| Tokens | 1.1 billion | 0.3 billion | 3.0 billion |
| API-equivalent | $364 | $244 | $1,067 |
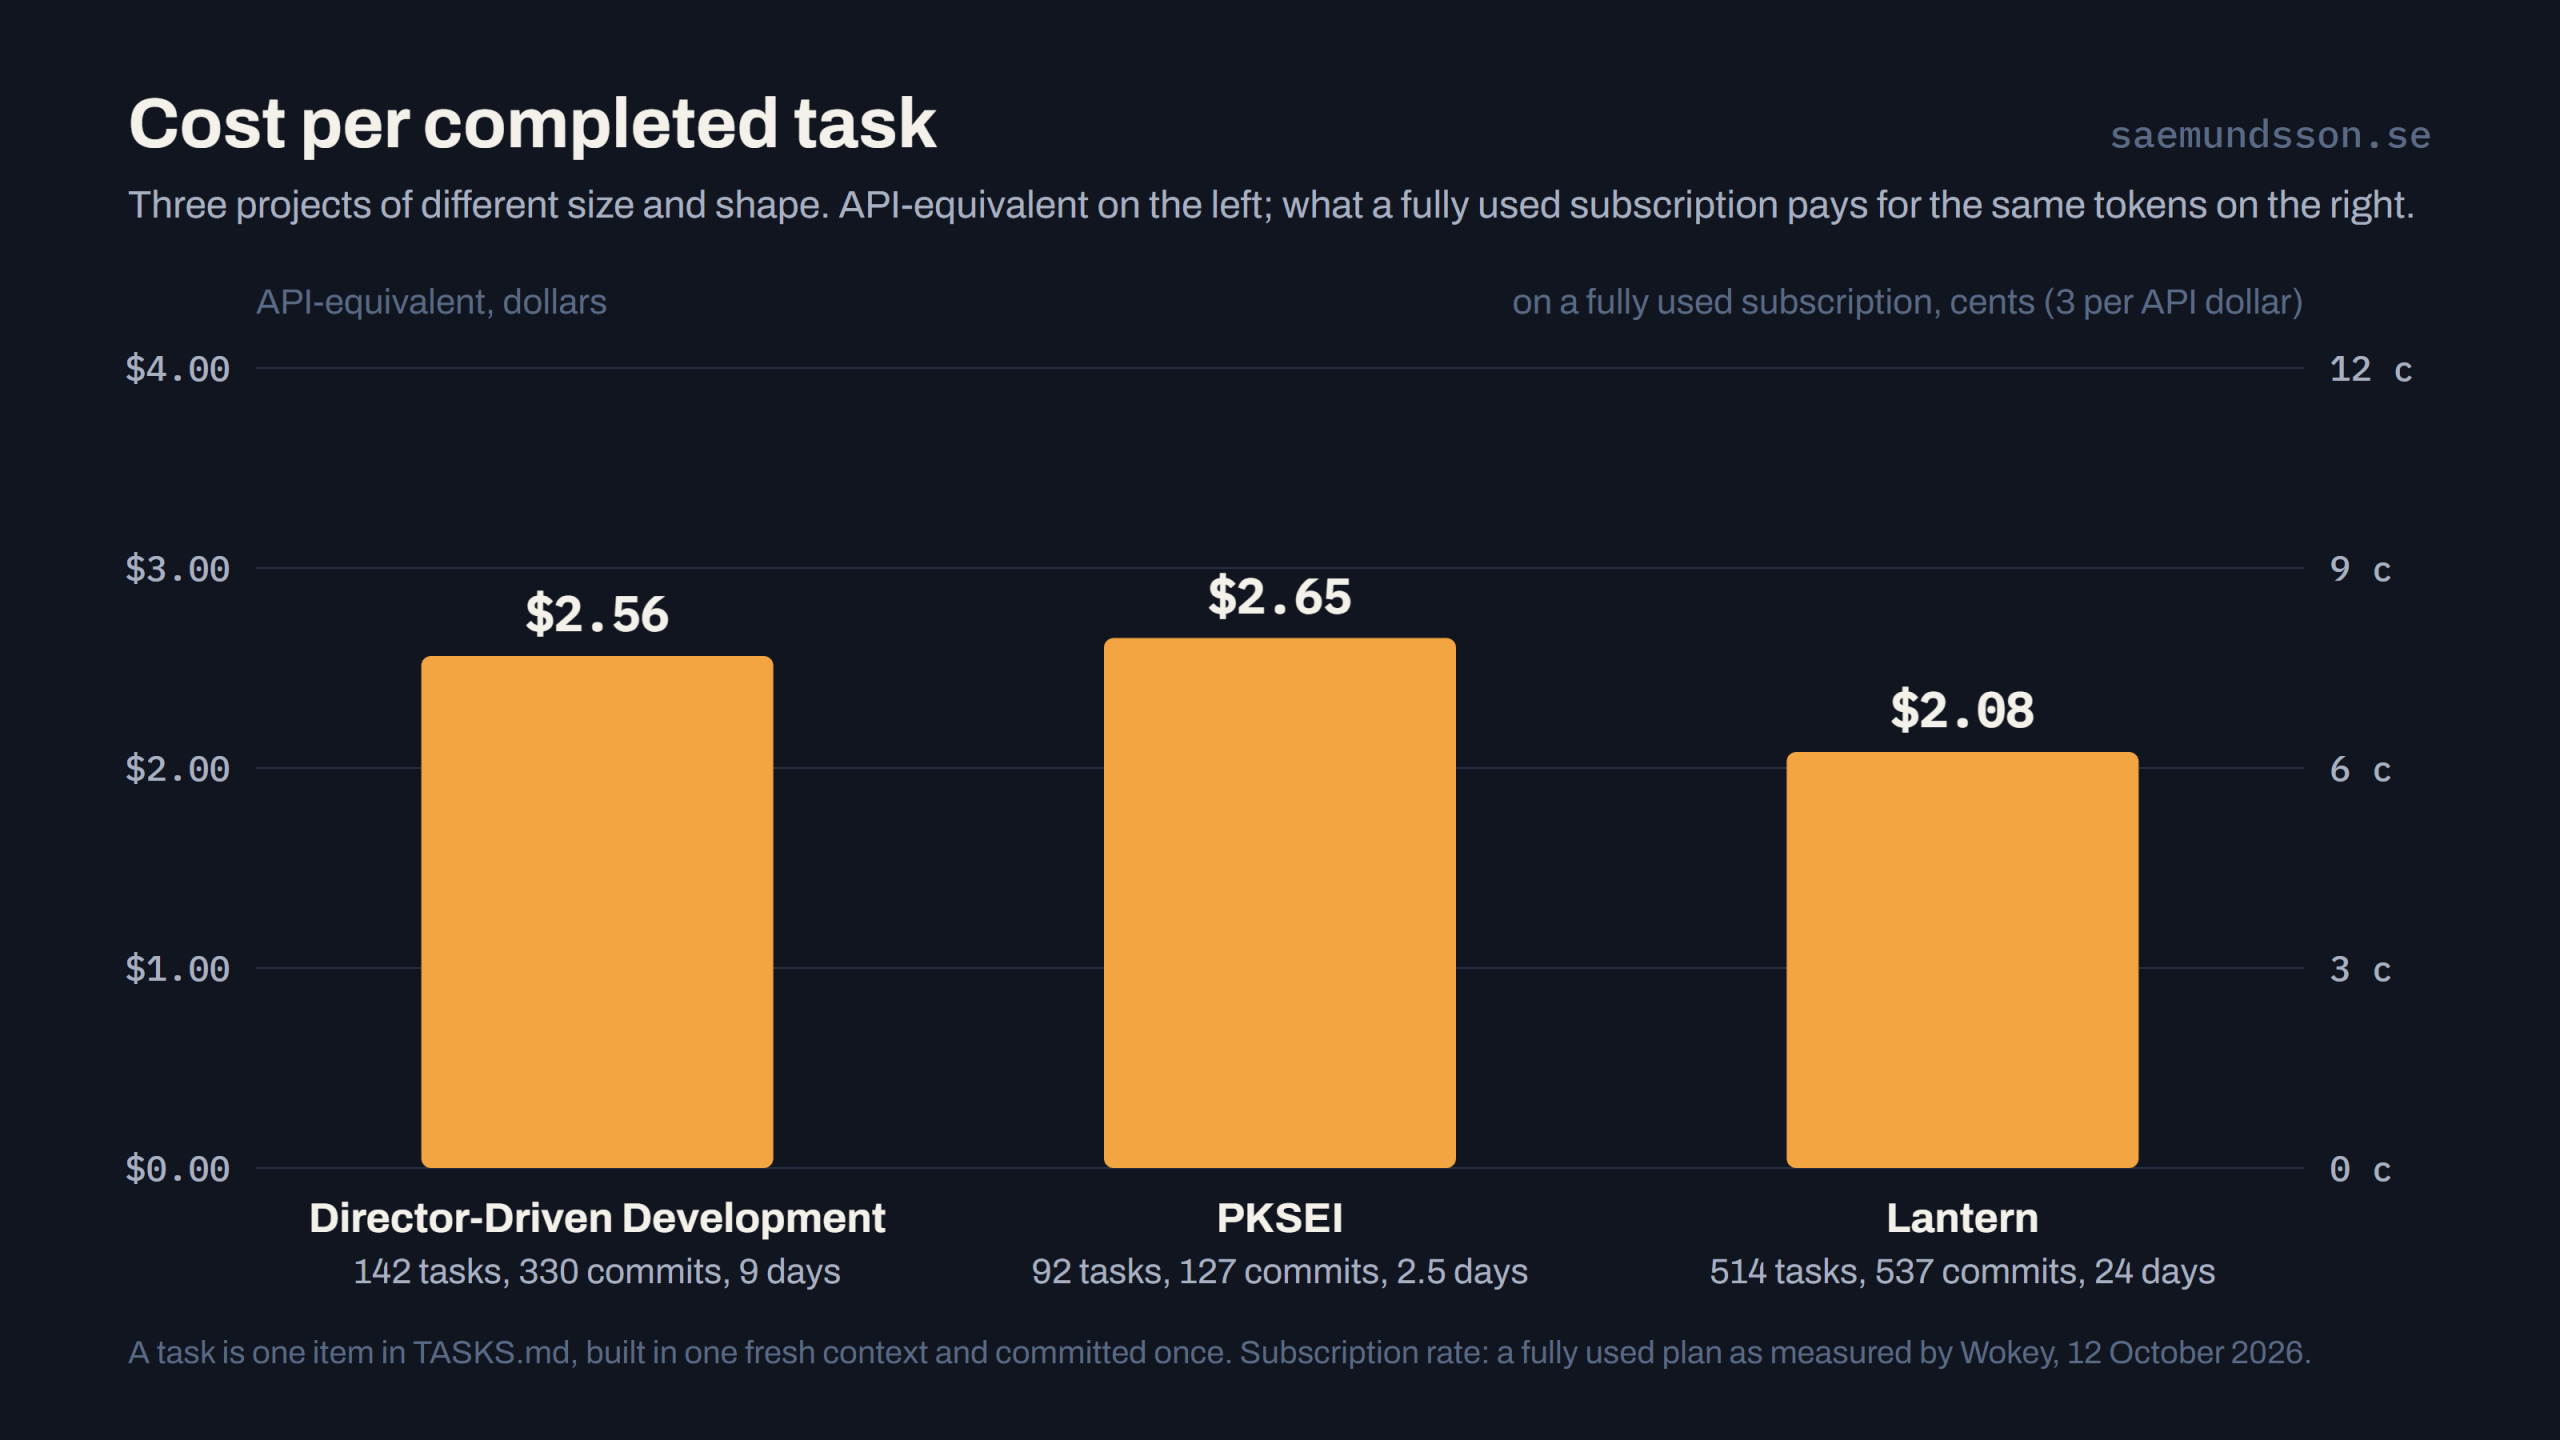
| Per completed task | $2.56 | $2.65 | $2.08 |
| Per hour at the keyboard | $22 | $84 | $36 |
What those tasks produced: a 44,000-word documentation site; 20 framework releases, including Godot-Director’s auto-playtesting (14,000 new lines); a 22,000-line game with its tests, generated art and sound, shipped to itch.io about twenty times.
“Hours at the keyboard” is every wait of thirty minutes or less that ended with a message from me: reading the agent’s report, deciding, typing. “On its own” is the rest of the time between events, the agent generating, running tools and waiting for its builders. Neither counts what happens away from the keyboard: playing the game on a phone, thinking, reviewing pull requests on GitHub. So my real hours are higher, by one to two on PKSEI alone by my own estimate, and the per-hour figures are upper bounds. The PKSEI devlog counts permission approvals as keyboard time too and gets 4.7 hours; the transcripts can’t tell an approval from a tool finishing, so this post leaves them out.
One source note: the PKSEI devlog quotes Claude Code’s own session report, $258 and 1.67 million output tokens for the build. The transcripts, which this post uses for all three projects so they compare, give $244 and 1.73 million; the two agree within six percent, the difference being two commits made after the report.
Where the money goes
Cache reads are 96 to 97 percent of the tokens and between a third and a half of the cost. Fresh input is nothing: my messages are a sentence or two. Output, which is all the code, tests, records and reports plus the models’ thinking, is half a percent of the tokens and 13 to 27 percent of the cost. The rest is cache writes: every builder that starts in a fresh context writes the records it reads into the cache, 80,000 tokens for a small item, a million for a large one.
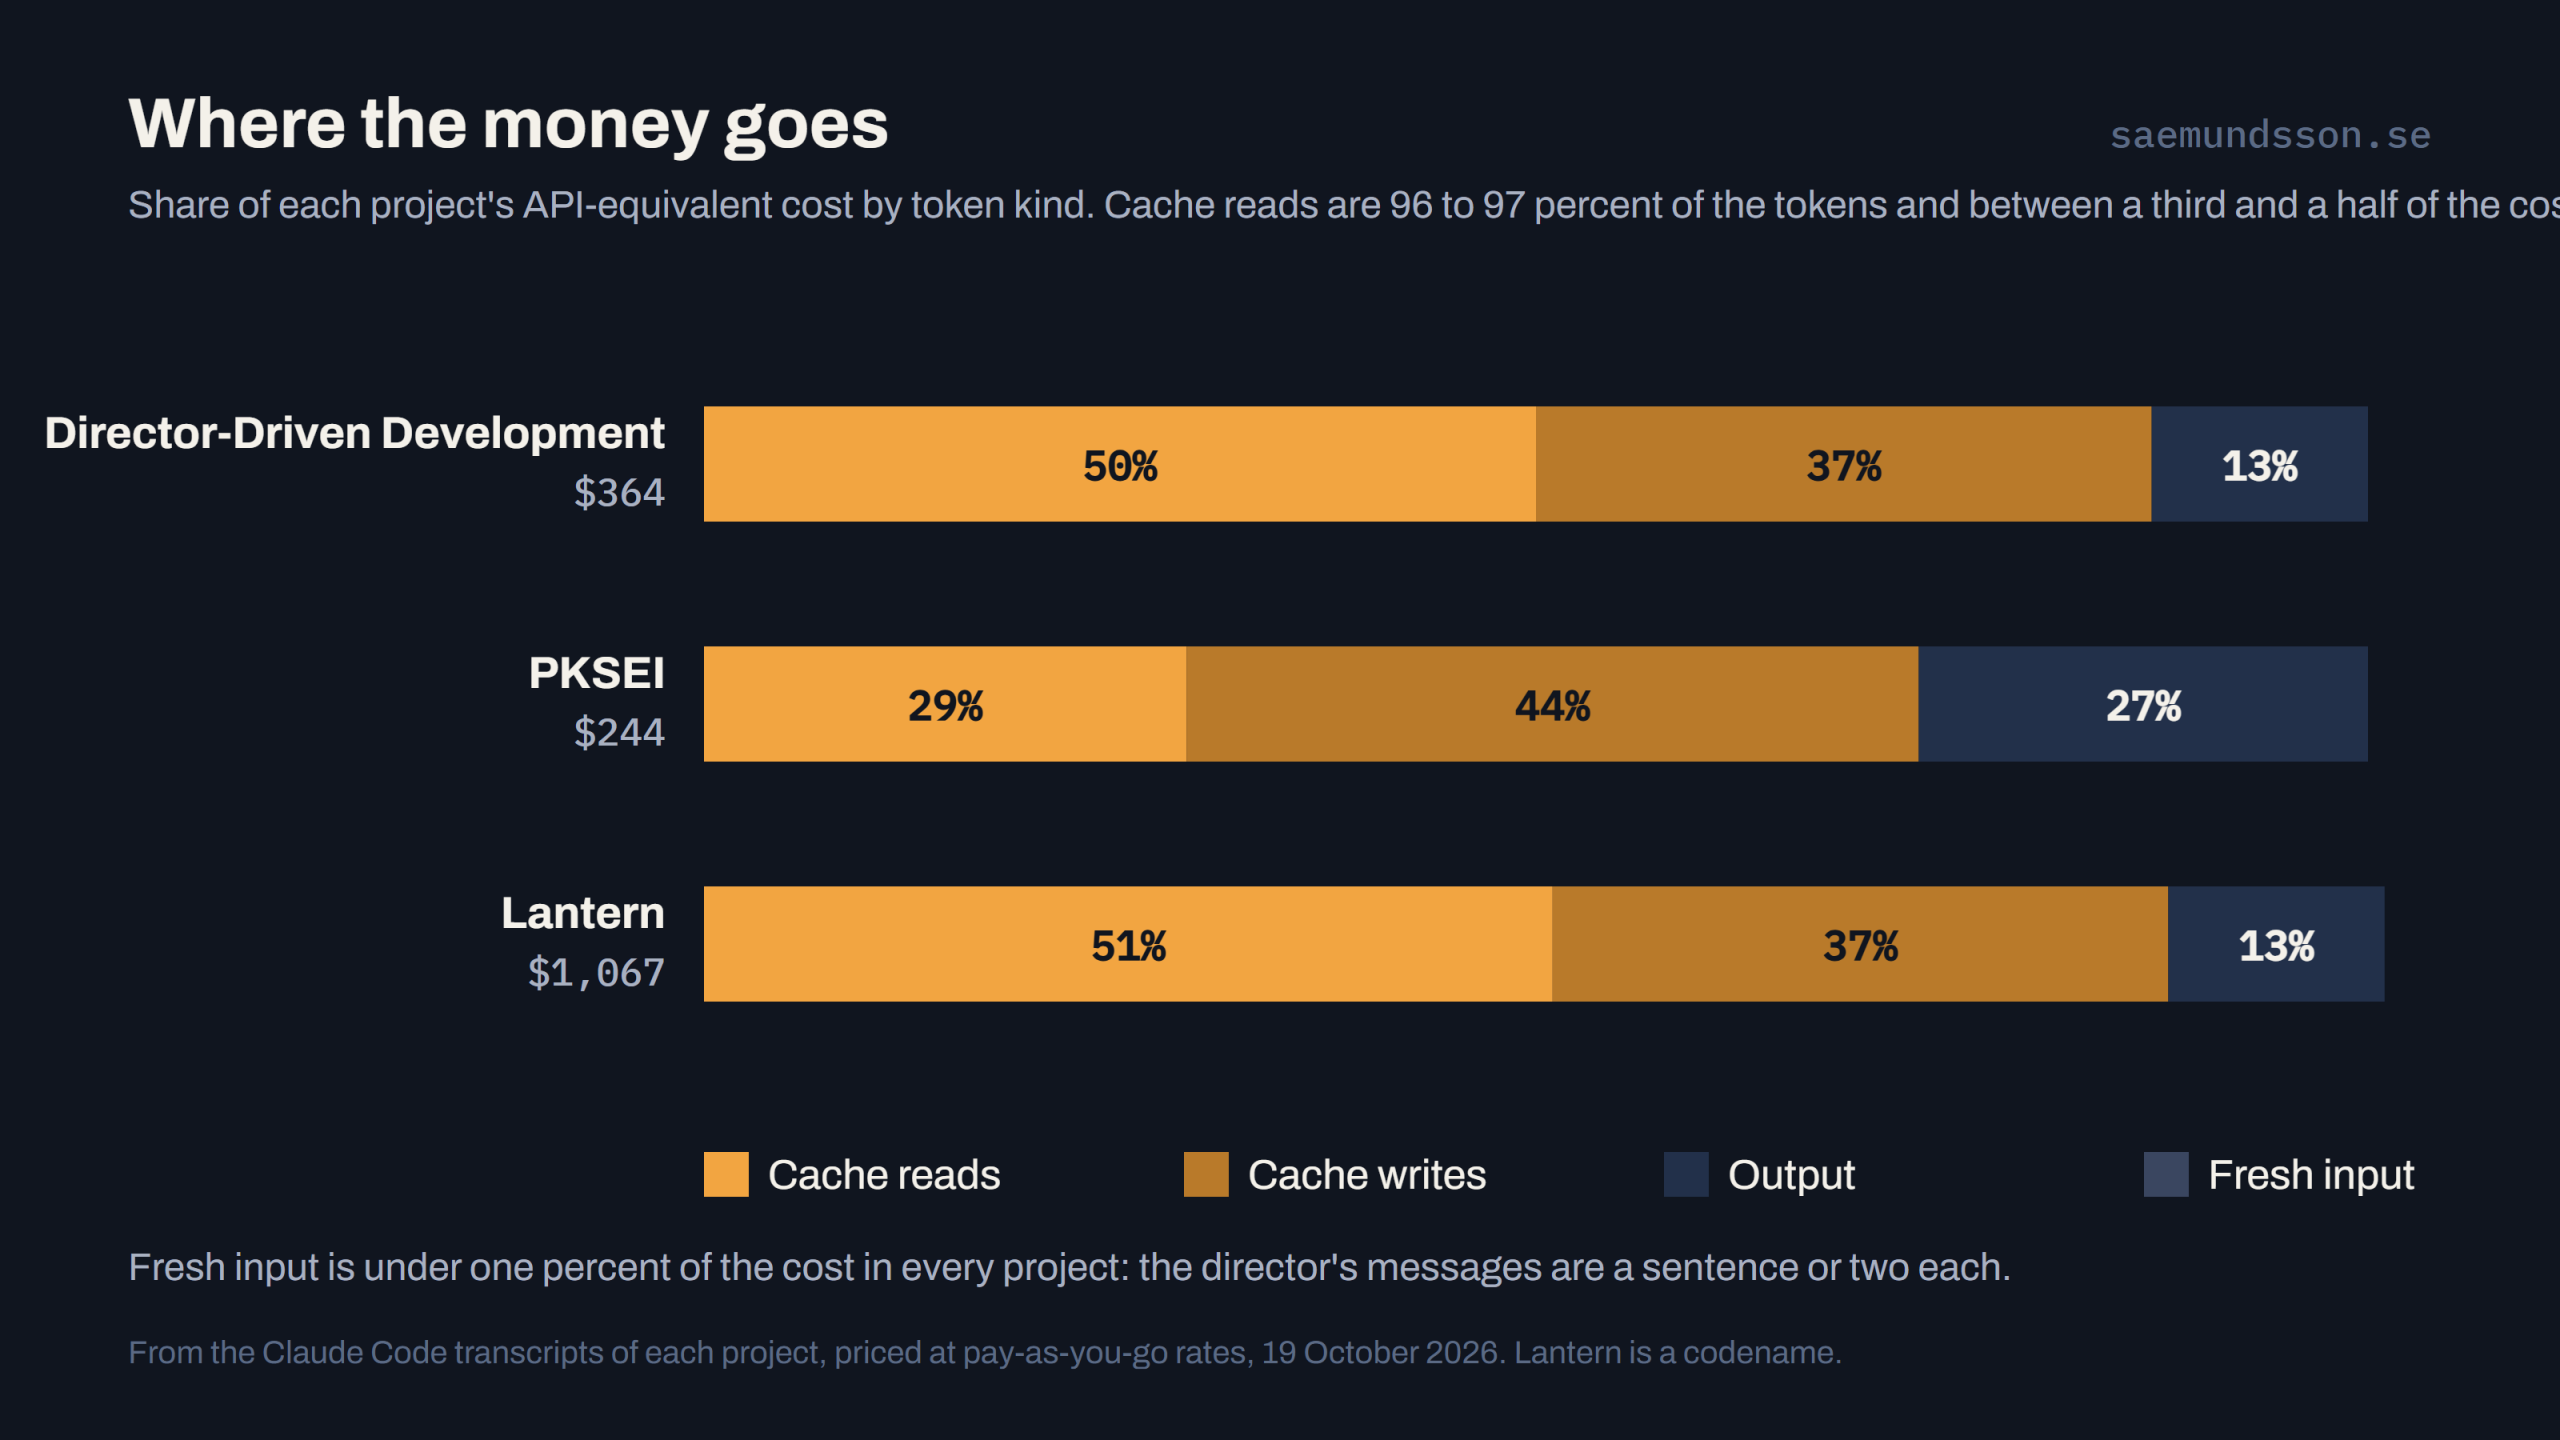
The surprise was who spends it. The orchestrating session, the one I talk to, accounts for 60 to 72 percent of the cost in all three projects. The builders, reviewers and researchers it starts are the rest. The orchestrator designs, keeps the records, reads every report, writes every commit and pull request.
What a change costs
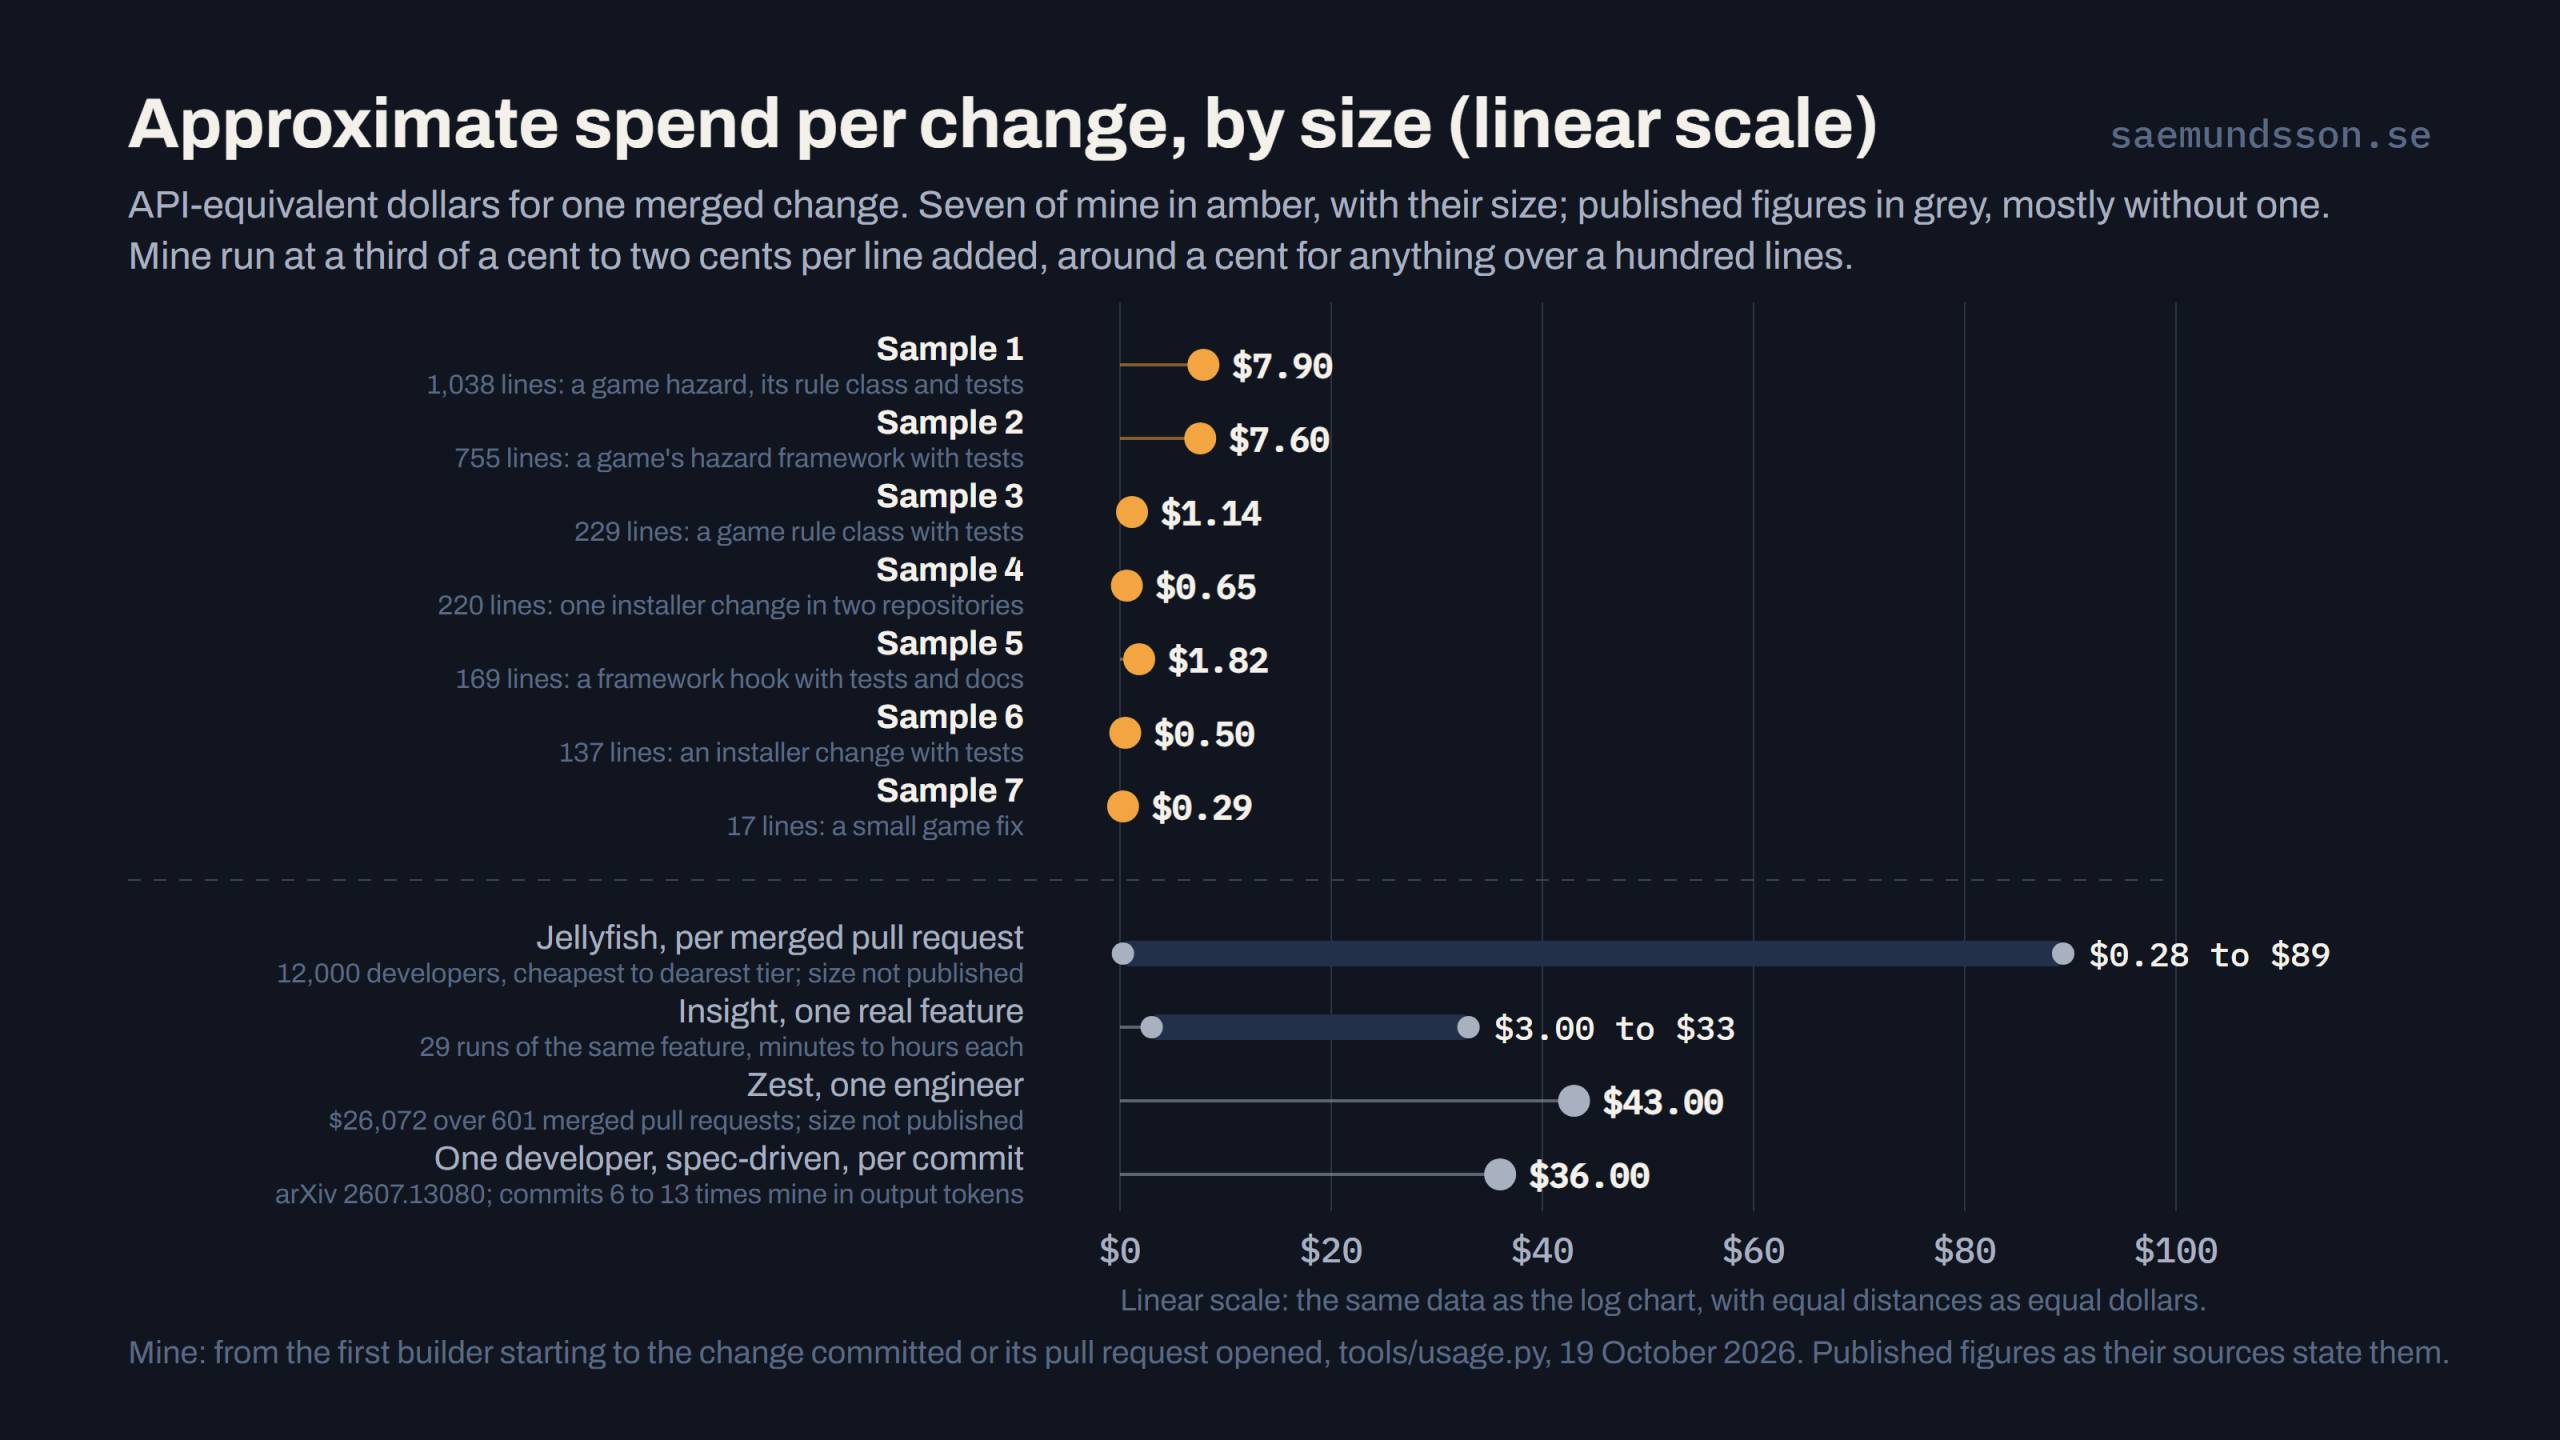
A task is small by design, so a cost per task is partly a statement about how I cut the work. Merged changes are the unit other people publish, so here are seven of mine from the three projects, large to small, measured from the moment the first builder started to the moment the change was committed or its pull request opened. The design conversation before the builder isn’t in these numbers; the builders, the reviewers and the orchestrator’s bookkeeping are. The sources at the end name each one.
| Sample | What it is | Size | API-equivalent |
|---|---|---|---|
| 1 | A game hazard, the beast that guards the lake’s edges: its rule class, scene and tests | 1,038 lines, 23 files, 1 commit | $7.90 |
| 2 | A game’s hazard framework: seeded bands, an effects palette, the first hazard, with tests | 755 lines, 21 files, 1 commit | $7.60 |
| 3 | A game rule class with its tests: paddling against the current | 229 lines, 9 files, 1 commit | $1.14 |
| 4 | The same installer change in two framework repositories, built in parallel | 220 lines, 8 files, 2 commits | $0.65 together |
| 5 | A framework adapter hook with its tests and docs | 169 lines, 12 files, 1 commit | $1.82 |
| 6 | An installer change with tests | 137 lines, 4 files, 1 commit | $0.50 |
| 7 | A small game fix: a swimmer shows his beer only while he has one | 17 lines, 2 files, 1 commit | $0.29 |
A third of a cent to two cents per line added, around a cent for anything over a hundred lines, and the orchestrator’s share grows as the change shrinks. One change is left out of the table and the charts because it is an order of magnitude larger than a typical task: a 6,687-line framework feature built in five commits, two of them with an independent Opus review, which cost $50 of API-equivalent and twenty minutes of my attention spread over four hours, at the same rate per line as the rest.
The published comparison is Jellyfish’s, from 12,000 developers in the first quarter of 2026, at list prices: cost per merged pull request from $0.28 in their cheapest tier to $89 in their most expensive, with a median of about 7 million tokens per pull request and 69 million in the top decile. They don’t say how big their pull requests are. Mine run from $0.29 to $7.90 with the size stated, and the one large feature, at $50, used twice the tokens of their top decile. One practitioner ran the same real feature 29 times through a dozen agents and harnesses and got $3 to $33 per merged feature. One developer published his own two months on Claude Code with a spec-driven workflow, which is close to mine: $36 per commit, $314 per day, with commits six to thirteen times the size of mine in output tokens. Per token of output we’re of the same order; per commit I’m far cheaper because my commits are far smaller.
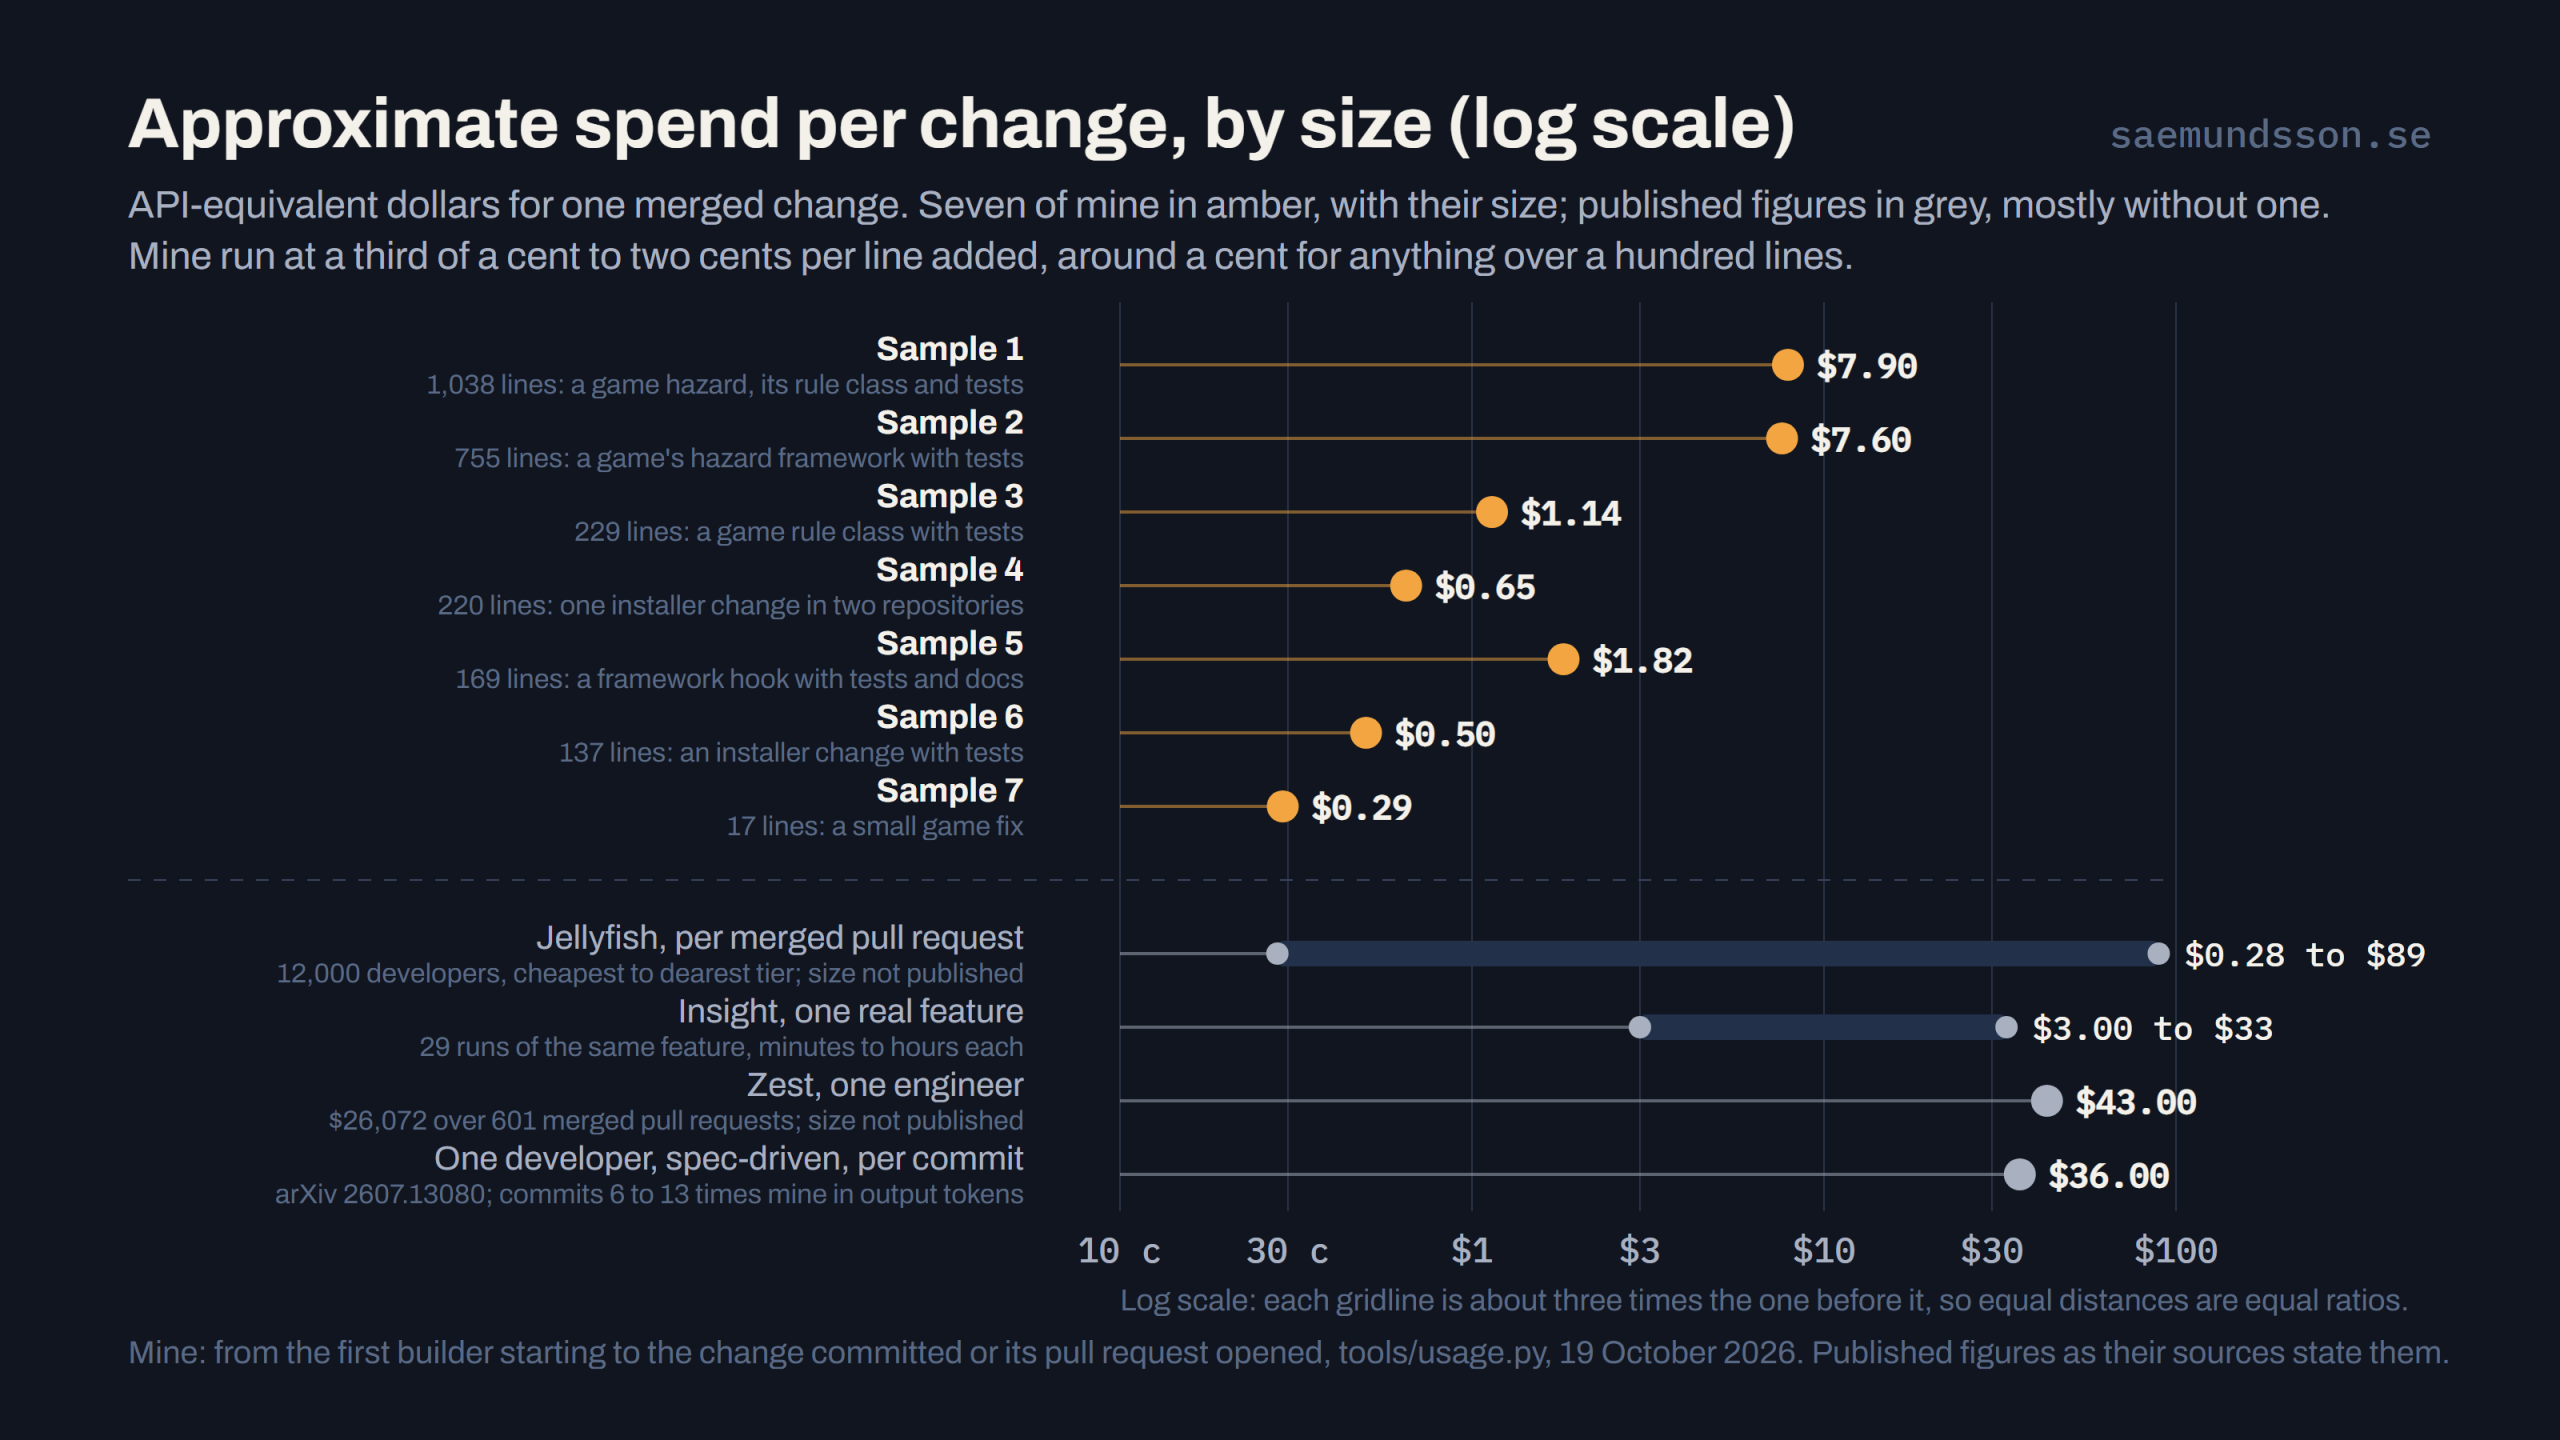
The same data on a linear scale, which is how the difference looks when the axis is money rather than ratios:
What the way of working does to the bill
Three things in the workflow show up in the numbers, and one thing I expected doesn’t.
It is cache-friendly. Without caching, the same tokens would cost eleven to twelve times more: $4,532, $2,847 and $11,773. Caching is Anthropic’s feature and any Claude Code session gets it, so I won’t claim the saving as mine. What the workflow contributes is stable context: the rules, the records and the task list live in files that every session and every builder reads the same way, so almost everything a model sees, it has seen before.
Small tasks, one commit each, keep the per-task cost flat. $2.08, $2.56 and $2.65 for three projects of very different size and shape. That consistency is the most useful number in this post, and it is partly a property of how the work is cut: a task is sized to fit one builder in one fresh context, and the size picks the model.
The director’s hours are the limit, not the tokens. At $20 to $85 of API-equivalent per hour at the keyboard, with the agent working one and a half to five hours on its own for each of mine, a full day of directing is a $200 to $700 day, and I can’t direct more than a day a day. The one week I ran three sessions in parallel is the week the bill was highest.
Model sizing saves less than I thought. Sending small items to Haiku and medium ones to Sonnet saved about 9 percent against running everything on Opus. The builders aren’t where the tokens are; the orchestrator is, and its model is the biggest single cost choice. In PKSEI I ran the orchestrator on Fable 5.1 on purpose, because I had weekly allowance to spare and wanted to try it: $136 of the project’s $244. The same session on Opus would have been about $55. I also found a mistake there: 48 of the 89 builder runs had inherited Fable from the session instead of getting the model their size called for, $94, nearly forty percent of the project’s cost, for no reason. The fix is a rule now queued in all three frameworks: a builder always gets its model passed explicitly. And a confession about the orchestrator: since moving to Max I have run design sessions on Opus and Fable because the allowance was there, not because the work needed it. Everything on Sonnet 5.5, orchestrator included, would have cost $198, $80 and $581 instead of $364, $244 and $1,067: a third to a half. I haven’t measured what that does to quality, so it’s a floor, not a recommendation.
What the subscription turns it into
Here is the money. Anthropic publishes the plan prices and the session multiples (Max 5x and Max 20x are five and twenty times Pro per five-hour window), not the weekly caps. Third-party measurements from real accounts fill the gap; the week of 12 October 2026, Wokey measured Pro’s weekly cap at about $170 of API-equivalent across 474 accounts and Max 20x at about $1,640 across 17. My own heaviest week, $1,155 across six projects with allowance left, agrees with the 20x figure.
| Pro, $20 | Max 5x, $100 | Max 20x, $200 | |
|---|---|---|---|
| Weekly cap, API-equivalent | about $170 | unmeasured; roughly half of 20x | about $1,640 |
| Per month if you use the week | about $740 | $2,000 to $4,000 | about $7,100 |
| What you pay per API dollar | about 3 cents | 3 to 5 cents | about 3 cents |
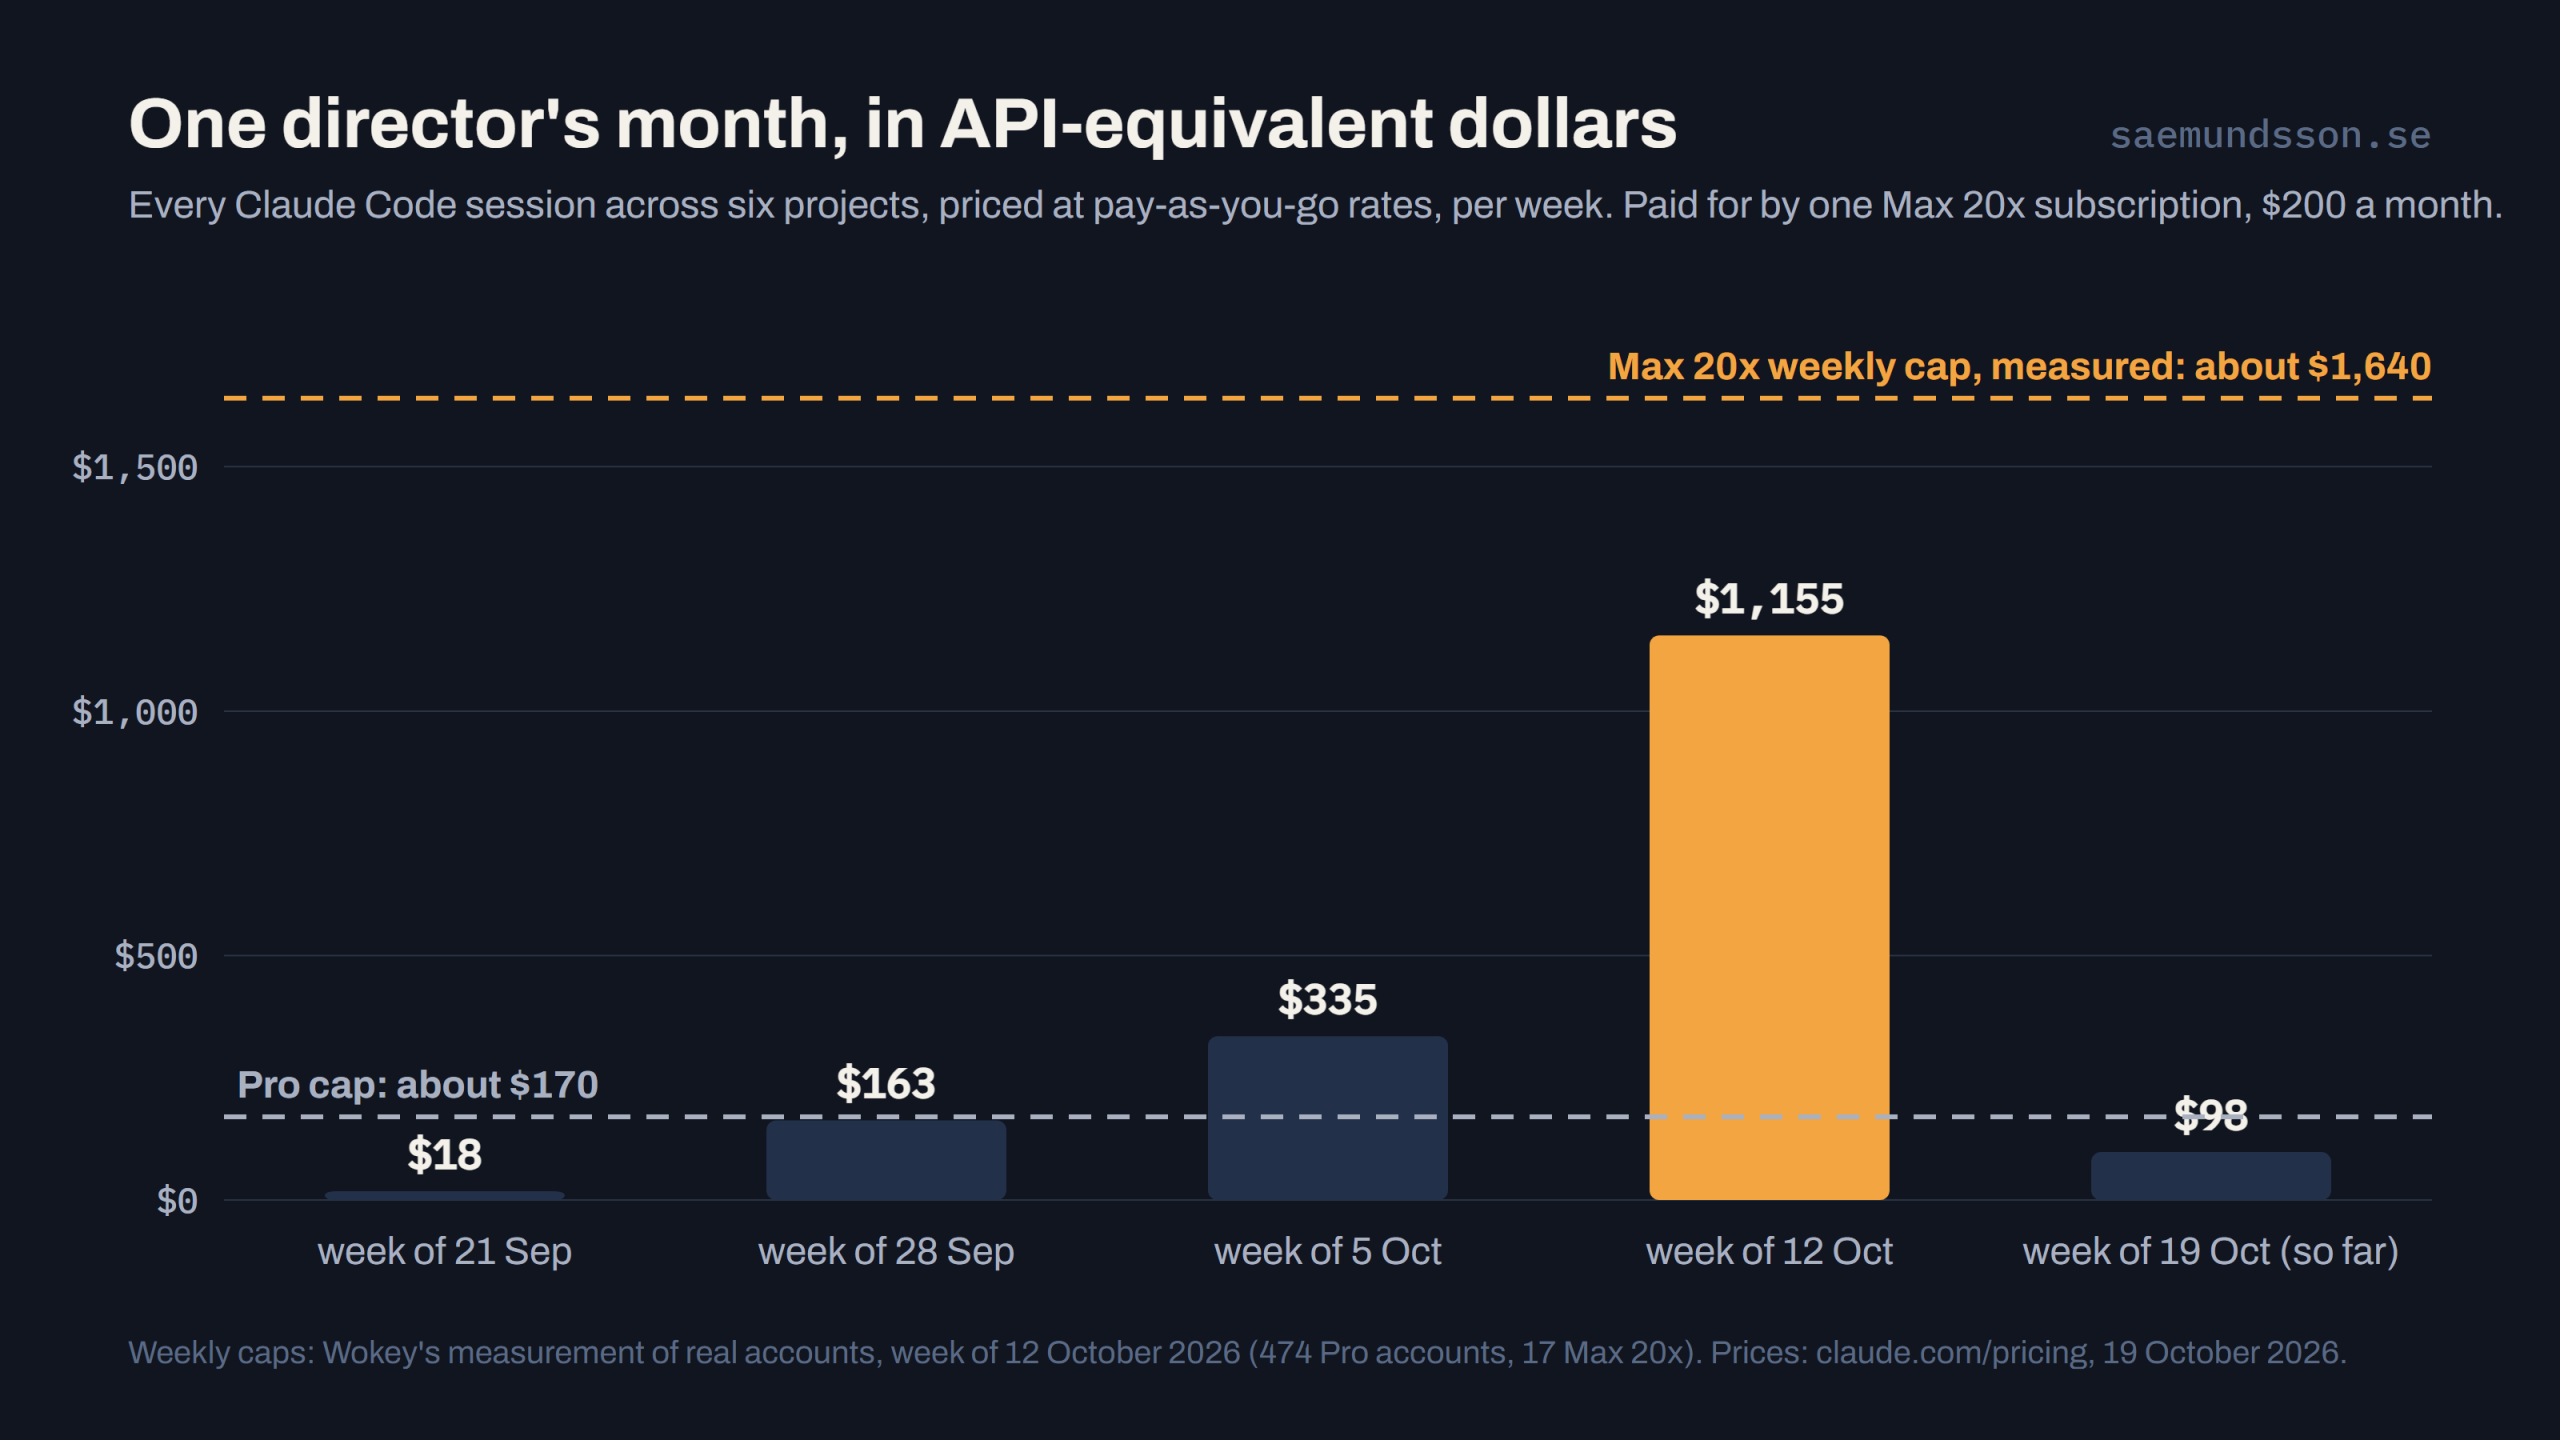
If the weekly limit is used, every plan delivers its tokens at roughly a thirtieth of the API price. The $2 to $3 per completed task becomes six to eight cents. The $50 feature pull request becomes a dollar and a half. The $20 to $85 per hour at the keyboard becomes under a dollar to two and a half.
Which plan fits: at $20 to $85 an hour at the keyboard, a Pro week covers two to eight hours of directing, a Max 5x week roughly six to forty, a Max 20x week twenty to seventy-five. The five-hour window binds first on Pro: about $14 of API value, which this way of working spends in well under an hour. So Pro suits a few hours a week in short sittings, Max 5x a part-time director, and Max 20x a full-time one, parallel sessions, and Fable, which on Max may use half the weekly cap at no extra charge but moves the meter about twice as fast as Opus. Past any cap, extra usage is billed at API rates.
How it sits next to what others measure
The structural numbers agree with outside data: Cursor reports that about 90 percent of its tokens are cache reads across two years of aggregate use, Jellyfish reports 96 percent across its customers, and an academic study of agent runs on SWE-bench finds cache reads the largest token category in every phase; my 96 to 97 percent fits. The cost-per-change comparison is the one above, and it is the one the claim rests on.
The productivity numbers don’t line up, because there’s nothing to line them up with. The large studies measure time on task, tasks or pull requests per developer, and cycle time, and they disagree: controlled trials range from 19 percent slower (METR’s 2025 trial of experienced developers in their own repositories) to 56 percent faster (a one-task trial with hired programmers); the telemetry studies that also count review load and defects find those rising faster than output. None joins billed cost to merged changes on real projects, no one reports work per million tokens, and no study separates a structured workflow from freeform use on cost or output, which is the measurement this post would need to claim more than it does. So I won’t put my 142 tasks in nine days next to anyone’s uplift figure. The honest comparison is the one above: same token shape, and pull requests inside the only published cost range, with their sizes stated and most of theirs not.
The conclusions
Director-Driven Development is an efficient way to turn attention into shipped work. Not because of a trick with models, but because the whole loop is built to be cached, cut small and recorded: a completed task costs $2 to $3 of API-equivalent whether it’s a docs page, a game rule with its tests, or a framework release; a 6,700-line feature with its tests costs $50 and twenty minutes of attention; and the records show where every dollar went. The bill scales with my hours, which is the constraint I’d choose.
Claude Code on a subscription is remarkable value for this way of working. Used to its weekly cap, a plan delivers tokens at about three cents on the API dollar; a few hours a week fit in Pro, a part-time director in Max 5x, and a full-time one, parallel sessions or Fable call for 20x.
And what I’m not claiming, because I didn’t measure it: that this is cheaper than building the same things another way, by hand or with an agent and no workflow. There is no baseline in these numbers, and no one has published one. Nor do they say anything about quality: PKSEI still has 116 placeholder values, and the frameworks’ /ui-design feature is still in my own acceptance test. The numbers say what three real projects cost, to the token, and that the cost was flat, predictable and small next to the subscription that paid for it.
Measure your own
The transcripts are in ~/.claude/projects/. The script that produced every number here, tools/usage.py in the Director-Driven Development repository, prints the same table for any project on your machine: the total at dated prices, the shares by token kind and by session, your hours at the keyboard, and what it would have cost uncached or on one model. Date your prices, state whether you mean API-equivalent or money, and keep the orchestrator’s model in view: it’s where the tokens are.
Sources
The seven changes: samples 1, 2, 3 and 7 are PKSEI commits 54daa59, a63c993, b637d7a and e66b0aa; 4 is App-Director #22 with SaaSAllTheThings #15; 5 and 6 are Godot-Director #27 and #29. The large feature left out of the charts is Godot-Director #25.
The published figures: Jellyfish, “Is tokenmaxxing cost effective?” (April 2026) and its State of AI in Software Engineering report for the cache-read share; Insight, “Token Price Is the Wrong Number” (July 2026); Zest’s Claude Code pricing page; arXiv 2607.13080 (one developer, two 28-day periods, spec-driven); Cursor’s usage data via The Pragmatic Engineer; arXiv 2604.22750 on token use in agent runs; METR’s 2025 trial and the 2023 Copilot trial for the range of productivity findings; Wokey’s measured usage limits for the weekly caps; claude.com/pricing for the API prices and plans; the PKSEI devlog for the game’s own report. All read on 19 October 2026.